Electrochemical Impedance Spectroscopy
Electrochemical Impedance Spectroscopy (EIS) is an advanced analytical technique used to study the dynamic characteristics and interfacial phenomena of electrochemical systems. By measuring the impedance response under alternating current (AC) excitation across a range of frequencies, EIS provides both a “fingerprint” and a “health check” for battery cells, battery modules, and fuel cells, among other things.
Importance of EIS
EIS combines chemistry and electrical engineering to accurately assess the internal state of batteries and fuel cells. In battery production, R&D, and reuse, EIS is used for:
- Mechanisms of Capacity Loss: Identifying Causes of Degradation Through Frequency-Domain Characteristics.
- Rapid Assessment of the State of Health (SOH): Quickly and reliably assess the health status of cells.
- Cell Sorting and Risk Selection: Filtering out high-risk cells/modules and matching modules for specific applications (such as energy storage, light electric vehicles, and UPS systems).
- Second-life applications: Valuable for quality control, incoming inspections, standard scans, and final acceptance testing for remanufacturing.
Basic Theory and Equivalent Circuit Modeling
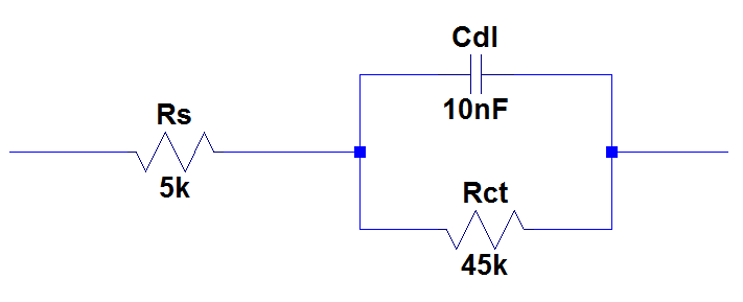
A battery cell’s response to an electrical load can be modeled as an equivalent electrical circuit (such as the Randles cell). This helps engineers understand the response to charging and discharging effects (such as pulsating direct current from switching chargers).
Key Parameters:
| Parameter | Description / Meaning |
| Internal / Series Resistance (Rt / ERS) | Represents the ohmic resistance of the metallic parts (plates/clamps) and the electrolyte. |
| Double-Layer Capacity | Capacitance that arises at the interface between the electrode and the electrolyte due to a double layer of ions. This produces the initial rapid current surges under dynamic loading. |
| Charge transfer resistance | Resistance caused by the transfer of ions between the electrolyte and the electrode. |
| Warburg Impedance | Represents the linear diffusion of ions at low frequencies. It has a constant phase angle of 45° and a slope of 1/2 on a logarithmic plot. |
Display of EIS Measurement Results
EIS measurements are primarily analyzed using two graphical representations:
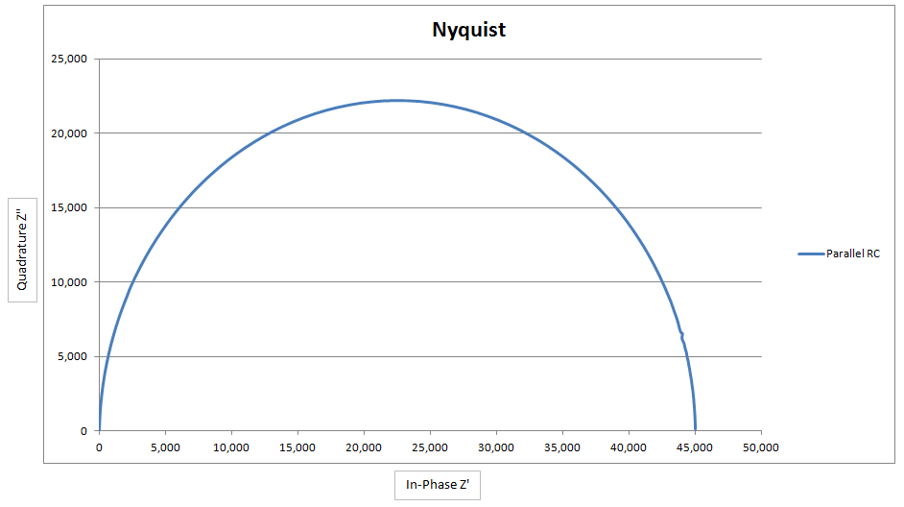
- Nyquist Plot: Plot the real impedance (Z’) against the imaginary/quadrature impedance (Z”). A simplified Randles cell shows a semicircle (due to the combination of Rct and Cdl, which is shifted from the origin by the value of Rs), followed by a rising line at an angle of less than 45° representing Warburg diffusion at low frequencies. The specific Cdl value can be calculated from the highest point of the semicircle.
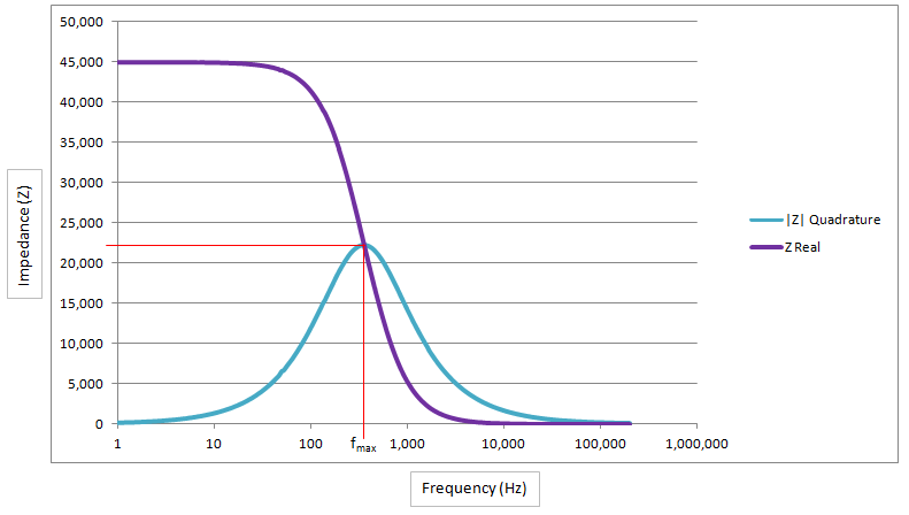
- Bode Plot: Plot the impedance magnitude and/or phase angle against frequency on a logarithmic scale. This provides immediate insight into the battery’s behavior at specific charge/discharge frequencies.
Integrated Test Solutions for Cell/Module Testing
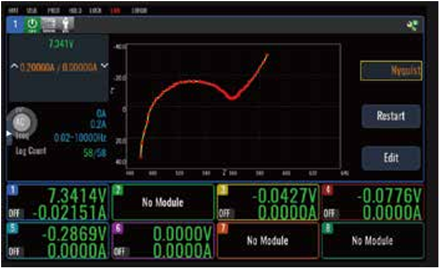
Modern measurement systems, such as the Itech IT2705 with the IT27814 SMU module, integrate EIS functionality directly into the test hardware. This offers significant advantages over traditional test setups:
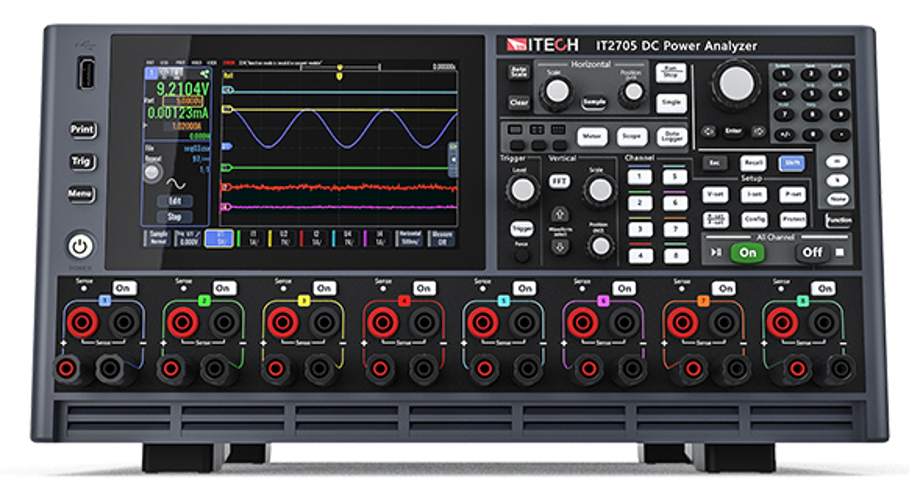
- All-in-One Functionality: Combines charging/discharging, EIS measurements, and ACIR measurements in a single system. Separate signal generators, data logger cards, shunts, or external PCs are no longer needed.
- Real-Time Graphical Analysis: Nyquist and Bode plots are automatically generated and analyzed to easily determine Rohm and Rct, as well as low-frequency diffusion characteristics.
- Wide Frequency Range: Scans from 0.01 Hz to 20 kHz to capture both fast transients and slow diffusion phenomena.
- High Accuracy & Speed: Measurements with nA precision, µs dynamic response, and built-in oscilloscope monitoring (up to 200 kHz) for observing start-ups and voltage dips.
- Multi-Channel & Parallel Testing: Up to 8 channels per mainframe with Kelvin 4-wire measurement and channel isolation, enabling batches of cells/modules to be tested and sorted synchronously within minutes.
The Itech IT2705
The IT27814 four-quadrant SMU module is equipped with a professional impedance spectrum analysis function, allowing battery impedance characteristics to be evaluated under various conditions to investigate internal behavior. With its built-in EIS function, it can capture subtle responses under multi-frequency excitation (0.1 Hz to 20 kHz), identifying potential issues that traditional methods may overlook. Test results can be displayed via Bode plots and Nyquist plots for intuitive visualization. Widely applicable for fuel cell evaluation, battery cell testing, and the assessment of power supply device performance and lifespan, it is a powerful tool for research into electrochemical characteristics.